Thesis Summary
Stacie L. Hibino, hibino at acm dot org
|
|
Thesis Summary
Stacie L. Hibino, hibino at acm dot org
|
Advisor: Professor Elke A. Rundensteiner
My thesis work focuses on the design, use, and evaluation of visual, dynamic, direct manipulation interfaces to multimedia databases. In my thesis, I am proposing that new visual paradigms--not just graphical flow-chart analogies to SQL queries or static forms-based interfaces--are needed for:
My approach to video analysis* is 1) to use spatio-temporal (multimedia) annotations to code objects and events in the video data, storing these annotations in a database, and 2) to apply and extend the VIS paradigm to video data (i.e., to design an interactive visualization environment for exploring the annotation database, by integrating a multimedia visual query language with a user-tailorable spatio-temporal visualization of results). The annotations are used to abstract atomic temporal and spatial, as well as semantic information from the video. The visual query language allows users to specify relative temporal and/or spatial queries between various types of annotations. In this way, not only can users query the annotation collection to find out when various events occur, but they can also query it to determine when events of different types meet a particular temporal and/or spatial relationship criteria (e.g., "show me all places in the video when events of type A start at the same time as events of type B").
While basic support for creating annotations will be provided, the primary focus of my thesis research is on the spatio-temporal analysis of video data. (Although users are currently required to create annotations by hand, we anticipate that advances in bit-level video analysis and object extraction (e.g., Hampapur et al., 1994; Nagasaka and Tanaka, 1992) will eventually be integrated to automate this process.) In particular, my thesis goals for applying and extending the VIS approach for video analysis include the following:
Figure 1 presents the system framework for applying and extending VIS to the problem of video analysis (Hibino and Rundensteiner, 1995b). In our MultiMedia VIS (MMVIS) environment, users use a set of Annotation Tools to first code the video data with annotations. They can then explore and analyze the video through iteratively specifying queries using a visual query language (VQL) and reviewing the visualization of results presented. Similar to VIS, our interface will be composed of dynamic query filters to allow rapid adjustment of query parameters via the use of buttons and sliders. This is in contrast to text-based query languages, where query specification and modification are typically much more complicated and non-intuitive.
The queries are interpreted by a VQL processor and then forwarded to the Database Manager. The retrieved results are passed to a Presentation Manager. The Presentation Manager takes the query results, along with any user-defined display preferences and updates a visualization. In this way, the visualization is updated every time users make changes to any query filter. Users can visually scan the results to look for data trends. If no trends are found, they can use the presentation language (PL) to clarify the visualization, the navigation controls to further explore query results, or the VQL to incrementally adjust the query. In addition, if users wish to test a new hypothesis or explore different characteristics of the data, they can use the VQL to do so. Thus, queries are expressed incrementally as users specify desired values for each query parameter. In such an environment, users can gain a sense of causality between adjusting a query filter and the corresponding changes presented in both the other query filters and the visualization.
Figure 2 presents the query palette for our temporal visual query language (TVQL). TVQL can be used to specify any one of the 13 primitive temporal relationships between events of non-zero duration (Allen, 1983), as well as any combination of them. The advantages of our TVQL design are 1) users can dynamically and incrementally refine their temporal queries by manipulating the slider thumbs, 2) the sliders provide continuous ranges of values allowing users to easily select a group of temporal primitives which are similar to one another (i.e., allowing users to select "temporal neighborhoods" (Freksa, 1992)), and 3) a dynamic temporal diagram is provided to visually clarify the specified query. The temporal diagram dynamically updates as users adjust slider thumbs, thereby providing a visual indication of the correlation between individual temporal primitives and the numerical ranges specified for the temporal end point relationships. The details and derivation of the TVQL are described elsewhere (Hibino and Rundensteiner, 1996; Hibino and Rundensteiner, 1995a).
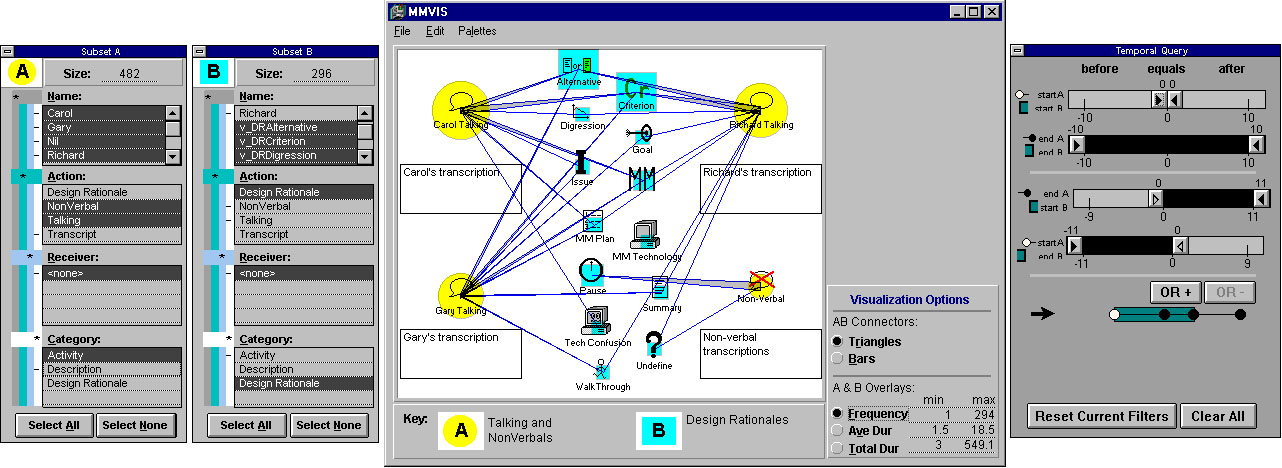
Yellow transparent circles are displayed in the visualization to highlight the corresponding A events, as the user de/selects values from each parameter list. Similarly, blue transparent squares indicate B events. The radius of these transparent overlays represent either relative frequency (Figure 3), average duration, or total duration, customized according to the user's preference. Display options are available in the lower right corner of the main MMVIS window. By switching back and forth between display options, the user can gain additional information about the data (e.g., such as whether or not events with low frequency have relatively high average duration).
As users manipulate the temporal query filters, they can also review the visualization of results (and changes in it) for trends and exceptions. The existence of a relationship between A and B events is visually indicated as a connector drawn between their centers. The width of the connector indicates the relative frequency of the temporal relationship. For example, Figure 3 indicates that Gary never starts talking at the same time as a Digression; and NonVerbal events frequently start at the same time as a Pause. TVQL can be used to easily browse variations on the temporal relationship specified. For example, users could adjust the second temporal query filter (endA-endB filter) to see how the visualization changes when Activities (Talking and NonVerbals) end before or at the same time as (but not after) Rationales end. This could be done simply by moving the right thumb to zero.
We evaluate the functionality of TVQL by comparing it to existing languages in terms of expressive power (i.e., what types of queries can and cannot be made; see thesis Chapter 3). The k-Bucket is a new index structure that I developed for the open problem of processing incremental multidimensional range queries, such as those posed using TVQL (Hibino and Rundensteiner, 1998b). We test efficiency of the k-Bucket (and thus TVQL) by comparing and contrasting algorithms for query processing. We tested the algorithms under different conditions (e.g., data set size, data distribution) to determine under what circumstances one performs better than another, as well as to examine the feasibility of (dynamically) adapting query processing to these different conditions. Our results show that the k-Bucket is the best overall performer for processing all data set sizes under eight of nine buffer conditions -- all conditions except for when processing very large data set sizes in a very small buffer size.
I demonstrate the viability and usability of MMVIS through prototype implementation and a case study applying MMVIS to the analysis of real video data, as well as through two user interface studies. The case study illustrates how MMVIS can be used to incrementally identify and compare various temporal data trends and how these results can then be used to investigate higher order trends. The first user interface study compares TVQL to a forms-based query language (TForms), showing that while TVQL takes longer to learn, TVQL subjects are more efficient and more accurate in specifying queries than TForms subjects (Hibino and Rundensteiner, 1997a). The second study compares the utility of MMVIS to a basic timeline for finding temporal trends, showing that subjects can use either interface to find interesting and complex temporal trends, but that MMVIS subjects are more accurate and are able to detect trends and exceptions, whereas timeline subjects are biased against finding exceptions to trends (Hibino and Rundensteiner, 1998a).
In the future, I plan to do the following:
Ahlberg, C., and Shneiderman, B. (1994). Visual Information Seeking: Tight Coupling of Dynamic Query Filters with Starfield Displays. CHI'94 Conference Proc., ACM Press, pp. 619-626.
Dimitrova, N. and Golshani, F. (1994). Rx for Semantic Video Database Retrieval. ACM Multimedia'94 Proceedings: ACM Press, pp. 219-226.
Freksa, C. (1992). Temporal reasoning based on semi-intervals. Artificial Intelligence, 54(1992), 199-227.
Hampapur, A., Weymouth, T., and Jain, R. (1994). Digital Video Segmentation. ACM Multimedia'94 Proceedings: ACM Press, pp. 357-364.
Harrison, B.L., Owen, R., and Baecker, R.M. (1994). Timelines: An Interactive System for the Collection of Visualization of Temporal Data. Proceedings of Graphics Interface '94. Canadian Information Processing Society.
Hibino, S. and Rundensteiner, E.A. (1998a). "Comparing MMVIS to a Timeline for Temporal Trend Analysis of Video Data," Advanced Visual Interfaces 1998 (AVI'98) Conference Proceedings. NY: ACM Press, 195-204. (258K gzip'd ps file, 147K gzip'd ps file of color plate)
Hibino, S. and Rundensteiner, E.A. (1998b). "Processing Incremental Multidimensional Range Queries in a Direct Manipulation Visual Query Environment," 1998 International Conference on Data Engineering (ICDE'98) Conference Proceedings. Los Alamitos, CA: IEEE Computer Society, 458-465. (224K gzip'd PS file)
Hibino, S. and Rundensteiner, E.A. (1997a). "User Interface Evaluation of a Direct Manipulation Temporal Visual Query Language," ACM Multimedia'97 Conference Proceedings. NY: ACM Press, 99-107. (308K gzip'd PS file)
Hibino, S. and Rundensteiner, E.A. (1997b). "Interactive Visualizations for Temporal Analysis: Application to CSCW Multimedia Data." In Intelligent Multimedia Information Retrieval (Mark Maybury, Ed.). Boston, MA: MIT Press, 313-335. (213 gzip'd PS file)
Hibino, S. and Rundensteiner, E.A. (1996c). "A Visual Multimedia Query Language for Temporal Analysis of Video Data." In Multimedia Database Systems: Design and Implementation Strategies (K. Nwosu, B. Thuraisingham, and P.B. Berra, Eds.). Norwell, MA: Kluwer Academic Publishers, 123-159. (242K gzip'd PS file)
Hibino, S. and Rundensteiner, E.A. (1995) "A Visual Query Language for Identifying Temporal Trends in Video Data," International Workshop on Multi-Media Data Base Management Systems (IW-MMDBMS'95). IEEE Computer Press, 74-81. (249K gzip'd PS file)
Hibino, S. and Rundensteiner, E.A. (1995) "Interactive Visualizations for Exploration and Spatio-Temporal Analysis of Video Data," IJCAI'95 workshop, Intelligent Multimedia Information Retrieval, Montreal, Quebec, Aug. 1995. (PS file)
Nagasaka, A. and Tanaka, A. (1992). Automatic Video Indexing and Full-Video Search for Object Appearances. Visual Database Systems, II (E. Knuth and L.M. Wegner, Eds.), pp. 113-127. Elsevier Science Publishers.
Olson, J., Olson, G., and Meader, D. (1995). What mix of audio and video is important for remote work. CHI'95 Conf. Proc. NY: ACM. 362-368.
Roschelle, J., Pea, R., and Trigg, R. (1990). VIDEONOTER: A tool for exploratory analysis (Research Rep. No. IRL90-0021). Palo Alto, CA: Institute for Research on Learning.
Snodgrass, R. (1987). The Temporal Query Language TQuel. ACM Trans. on Database Systems, 12(2), 247-298.
Hibino, S. and Rundensteiner, E.A. (1998a). "Comparing MMVIS to a Timeline for Temporal Trend Analysis of Video Data," Advanced Visual Interfaces 1998 (AVI'98) Conference Proceedings. NY: ACM Press, 195-204. (258K gzip'd ps file, 147K gzip'd ps file of color plate)
Hibino, S. and Rundensteiner, E.A. (1998b). "Processing Incremental Multidimensional Range Queries in a Direct Manipulation Visual Query Environment," 1998 International Conference on Data Engineering (ICDE'98) Conference Proceedings. Los Alamitos, CA: IEEE Computer Society, 458-465. (224K gzip'd PS file)
Hibino, S. and Rundensteiner, E.A. (1997a). "User Interface Evaluation of a Direct Manipulation Temporal Visual Query Language," ACM Multimedia'97 Conference Proceedings. NY: ACM Press, 99-107. (308K gzip'd PS file)
Hibino, S. and Rundensteiner, E.A. (1997b). "Interactive Visualizations for Temporal Analysis: Application to CSCW Multimedia Data." In Intelligent Multimedia Information Retrieval (Mark Maybury, Ed.). Boston, MA: MIT Press, 313-335. (213 gzip'd PS file)
Hibino, S. and Rundensteiner, E.A. (1996a). "MMVIS: Design and Implementation of a MultiMedia Visual Information Seeking Environment." ACM Multimedia'96 Conference Proceedings, NY: ACM Press, 75-86. (1.6Meg gzip'd pdf file, 363K gzip'd PS file)
Hibino, S. and Rundensteiner, E.A. (1996b). "Query Processing in the MultiMedia Visual Information Seeking Environment: A Comparative Evaluation," University of Michigan, Technical Report, CSE-TR-308-96. (updated 118K gzip'd PS file)
Hibino, S. and Rundensteiner, E.A. (1996c). "A Visual Multimedia Query Language for Temporal Analysis of Video Data." In Multimedia Database Systems: Design and Implementation Strategies (K. Nwosu, B. Thuraisingham, and P.B. Berra, Eds.). Norwell, MA: Kluwer Academic Publishers, 123-159. (242K gzip'd PS file)
Hibino, S., and Rundensteiner, E. A. (1996). "MMVIS: A MultiMedia Visual Information Seeking Environment for Video Analysis," CHI'96 Conference Companion, Formal Demonstration Summary. (postscript file)
Hibino, S. (1996). "Extending and Evaluating Visual Information Seeking for Video Data," CHI'96 Conference Companion, CHI'96 Doctoral Consortium, 1996. (postscript file)
Hibino, S. and Rundensteiner, E.A. (1995) "A Visual Query Language for Identifying Temporal Trends in Video Data," International Workshop on Multi-Media Data Base Management Systems (IW-MMDBMS'95). IEEE Computer Press, 74-81. (249K gzip'd PS file)